How Much Does the Average Company Spend on SaaS Per Employee? The 2026 Benchmark
SaaS spend per employee is the budget line that keeps founders and finance leads awake. The 2026 benchmarks disagree — here is the number to trust, by industry and size.
SaaS spend per employee is the budget line that keeps founders and finance leads awake, and for good reason: the number is climbing, it is spread across dozens of receipts nobody fully owns, and the public benchmarks disagree with each other. Before you audit your own stack, you need a baseline worth trusting.
Here is the uncomfortable part. The three most-cited 2026 benchmarks for per-employee software spend do not agree — and the gap between them is not a rounding error. One tracker says just under $7,000, another says $9,450, and a third puts the median at $9,455. Same year, same question, three answers. This post reconciles them, explains what actually drives the number, and gives you the benchmark that is defensible for your company's size and industry.
One question, three different answers
The most transactional number comes from Vertice's spend data: average SaaS spend per employee reached $9,450 per year in Q3 2026, up 1.4% from $9,324 in Q2, after holding flat at $9,200 for three straight quarters through Q1 2026. Vertice measures processed spend across its customer base, so this is what companies are actually paying, not what they budget.
Zylo's 2026 SaaS Management Index, built on more than 40 million licenses and $75 billion in spend under management, lands on a median of $9,455 per employee — within five dollars of Vertice's average. That near-perfect agreement looks reassuring until you read it carefully: one is a mean, one is a median, and both describe organizations that buy through spend-management platforms, which skew mid-market and enterprise.
Cledara, whose 2026 benchmark analyzes 1.8 million purchases across 6,800 tools in 87 countries, arrives lower: US companies average $349,000 in annual SaaS spend, which works out to roughly $6,980 per employee at a 50-person company — and only $3,490 at a 100-person company, because shared platforms spread across more seats.
| Benchmark | Figure | Method |
|---|---|---|
| Vertice (Q3 2026) | $9,450 avg / employee / yr | Processed spend, mid-market + enterprise |
| Zylo 2026 Index | $9,455 median / employee / yr | 40M licenses under management |
| Cledara (US) | ~$6,980 / employee / yr at 50 people | 1.8M purchase transactions, SMB-weighted |
So which is "the" number? None of them alone. The disagreement is the story: mean versus median versus size-normalized average measure different populations and different definitions of "SaaS spend." A 50-person agency with 40 subscriptions and a 5,000-person company with 300 will both quote the same industry benchmark — and both be wrong about themselves. The right move is to pick the benchmark whose population matches yours, then compare yourself to your industry, not the global average.
Why the number keeps climbing in 2026
After three quarters of flat spend, per-employee cost resumed rising in Q2 2026, and two forces explain most of it. The first is SaaS inflation. Vertice's tracking shows vendor price increases accelerated to 16.4% in June 2026, the highest monthly rate on record, before settling around 14.3%. Even a company that adds zero new tools sees its per-employee spend rise as contracts renew at higher list prices. Negotiation is no longer a procurement nicety; it is the main lever on the line item.
The second force is AI. Zylo found AI-native applications are now the fastest-growing spend category, up 108% year over year overall and 393% in organizations with more than 10,000 employees. Cledara's benchmark reaches the same conclusion from purchase data: expect 15–25% of new SaaS spend to go to AI capabilities over the next 12–24 months. Meanwhile the sprawl underneath continues — large enterprises add an average of 21 applications per month even as total counts look flat, and Cledara observed new subscriptions per company jump from 53 to 401 per month between early 2025 and now, as trials quietly convert to licenses.
The median company runs about 25 active subscriptions. The most tech-aggressive firms manage 49 or more — and every one of them renews on its own date, bills to its own card, and re-prices on its own cycle.
That is why the flat portfolio is a mirage. Application counts that look stable mask rapid turnover underneath: teams rotate tools in and out faster than the license true-up cycle catches, and per-employee cost spikes as trials convert. If you are not tracking subscription additions monthly, your benchmark number is already stale by the time you read it.
The waste hiding under the benchmark
The second half of the story is not what you spend — it is what you spend without using. Against industry-recommended utilization levels, organizations leave an average of 36% of SaaS licenses unused, according to Zylo's 2026 index data. Average license utilization was 54% in 2025, up from 47% in 2024 — improving, but still leaving nearly half of paid seats idle. Zylo estimates the bill at $19.8 million per organization per year in wasted spend on unused licenses, scaling from $3.8 million even at companies of 1–500 employees to $80.6 million for those with 10,001+.
Industry context sharpens the picture. Vertice's industry breakdown puts healthcare at $10,150 per employee and IT at $10,050 — the highest — while media and entertainment sits near $3,250. Finance-heavy organizations spend upward of $10,000 per head, manufacturing closer to $2,000. A single global benchmark is therefore close to useless for any individual company; the spread by industry is roughly 3x.
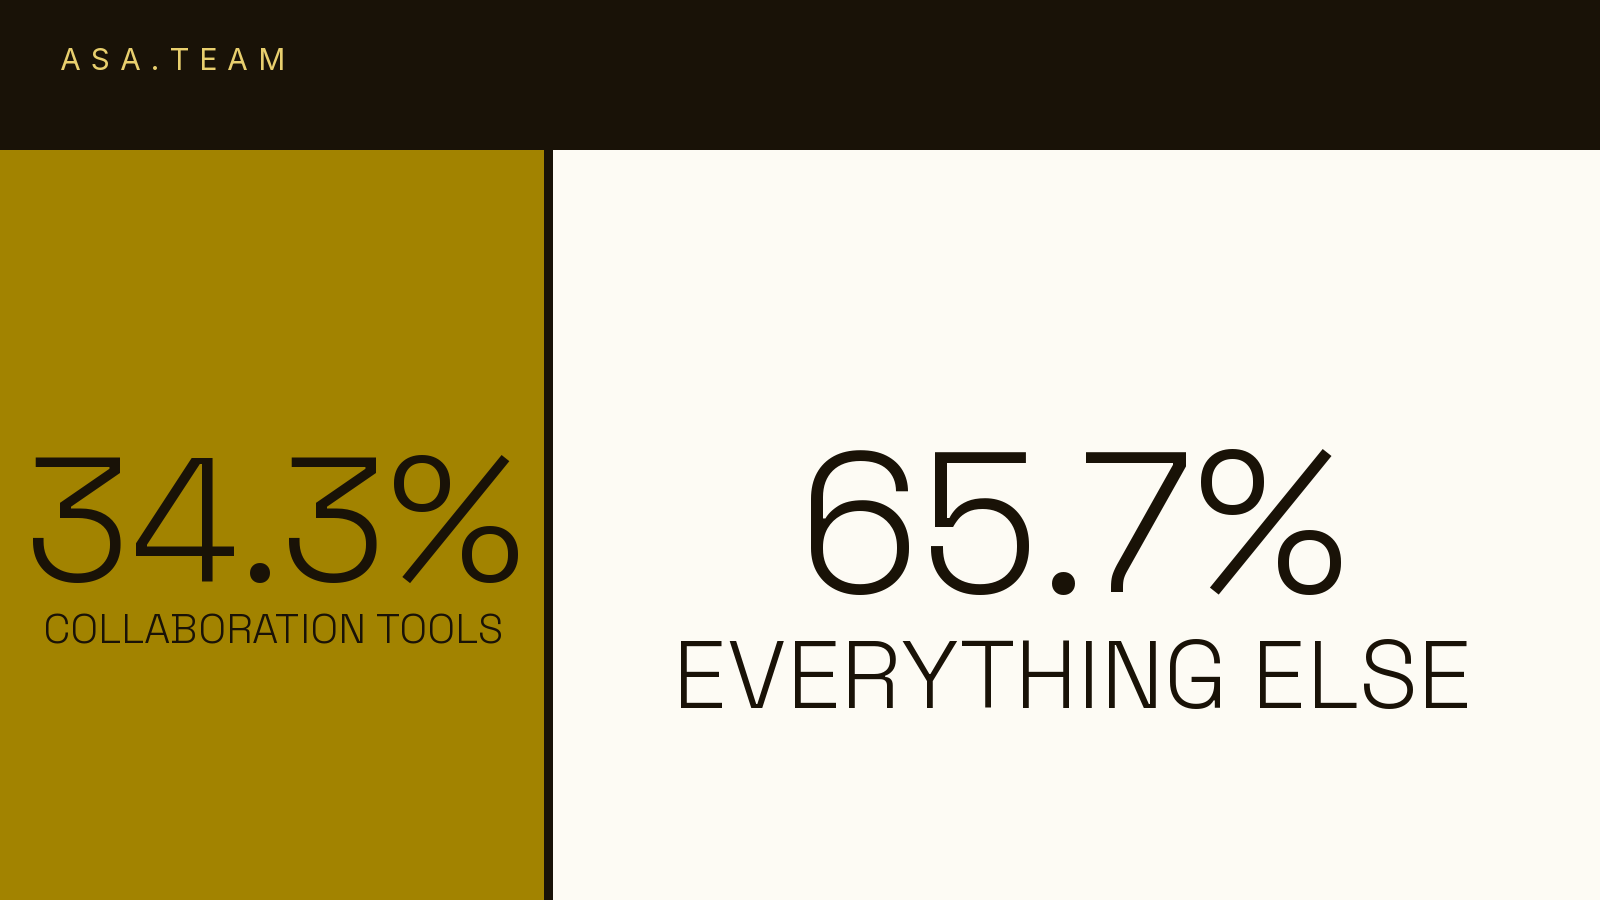
Where does the money go? Cledara's category analysis of a $6,000-per-employee budget: collaboration and productivity tools absorb 34.3% of all SaaS spend — the largest single bucket, about $2,058 per person per year — followed by engineering tooling at 16% and marketing technology at 13.3%. If collaboration exceeds roughly 45% of your SaaS budget, you are likely paying multiple times for the same communication layer.
That last point matters more than it looks, because the collaboration bucket is where status lives: chat, video calls, task boards, email. Teams that run five status surfaces are not just paying five bills — they are paying the coordination tax on every project, chasing updates across tools that each hold a fragment of the truth. The app-count benchmark and the tool-sprawl cost analysis cover the sprawl side; the spend benchmark is the same problem wearing a CFO's glasses.
What good looks like
A good software spend practice has three habits. First, benchmark against your industry and size band, not the global average — healthcare at $9,000 looks fine; media at $9,000 means you are three times your peer group. Second, track utilization alongside spend: a rising per-employee number is defensible at 90% license utilization and indefensible at 54%. Third, treat the collaboration bucket as consolidation territory, because it is the one category where overlap is structural rather than accidental.
Consolidation does not mean fewer tools on the invoice — it means fewer places the truth lives. This is exactly where Project Intelligence earns its seat: instead of asking people to check five tools for project status, Asa.Team surfaces updates from Slack, Teams, Telegram, and WhatsApp into one project picture, so the communication stack stops multiplying into new subscriptions that duplicate what you already pay for. Teams that consolidate status this way usually find the savings are not one canceled license — they are the dozen "temporary" tools that stop getting added in the first place.
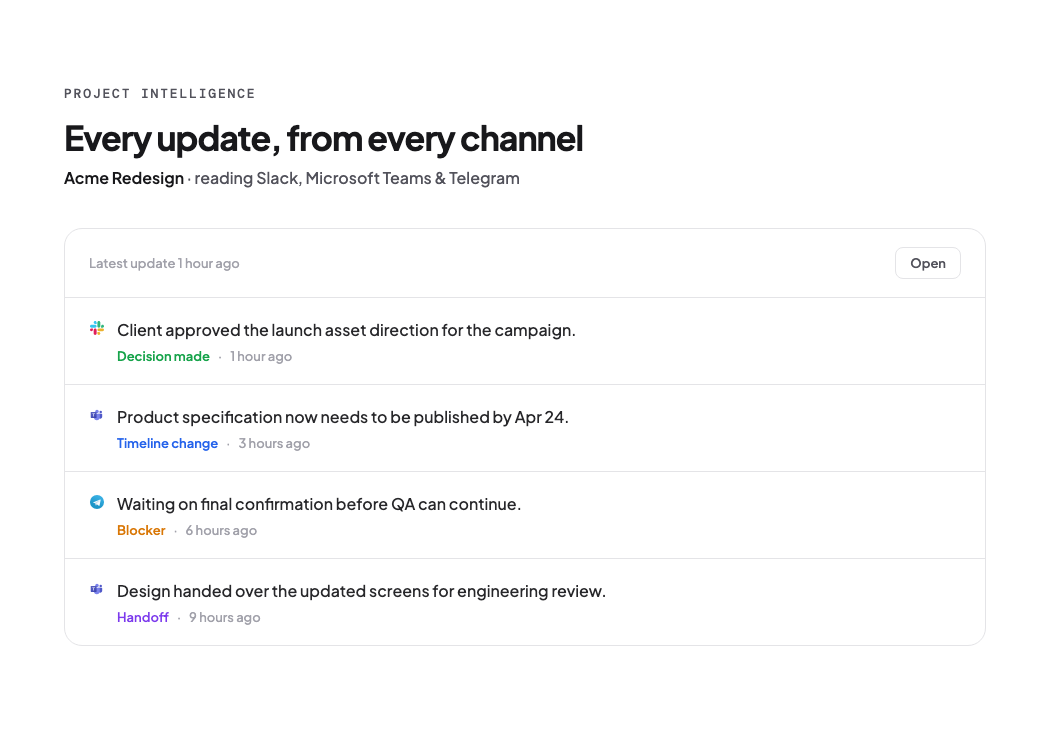
The math follows from the data. If collaboration tools are 34.3% of per-employee spend and roughly a third of licenses go unused, the biggest recoverable line in most SaaS budgets is the overlap between communication tools that all claim to be "where work happens." One source of truth is cheaper than five, both in dollars and in the coordination tax the benchmark can't even see.
Frequently Asked Questions
What is the average SaaS spend per employee in 2026? Between roughly $7,000 and $9,500 per year depending on the source. Vertice reports a $9,450 average, Zylo a $9,455 median, and Cledara about $6,980 for US companies at 50-person scale. The spread reflects method and company mix, not a data error.
Is $9,450 per employee high? It depends on industry. Healthcare and IT run above $10,000; media sits near $3,250. For most knowledge-work SMBs, anything above $250–$350 per employee per month deserves a utilization review.
How much SaaS spend is wasted? About 36% of licenses go unused against recommended utilization, and average license utilization was 54% in 2025. For a mid-size organization that typically means millions per year in avoidable spend.
Why do the benchmarks disagree so much? Because they measure different things: Vertice averages processed spend across its customers, Zylo reports a median of managed licenses, and Cledara normalizes purchase volume by company size across a broader, SMB-heavier sample.
The bottom line
Per-employee SaaS spend is a real benchmark now — $9,450 is the number to quote and roughly $7,000 is the number to budget if you are smaller than the trackers' customer base — but the honest version of the answer is a range with a method attached. The rising curve is driven by record vendor inflation and an AI purchasing wave that is only starting; the flat portfolio is a mirage hiding 21 new apps a month; and about a third of what you spend buys licenses nobody opens.
So before the next renewal cycle, ask the question the benchmark can't answer for you: not "what do companies spend per employee," but "what would we spend per employee if every tool we pay for were used, and no two of them said the same thing?" If that number is a lot lower than $9,450, the gap is not a procurement problem. It is a consolidation problem — and consolidation starts with deciding where the truth about your projects actually lives.