Unlimited PTO vs. Accrued PTO: The Real Difference (And Which One Your Team Will Actually Use)
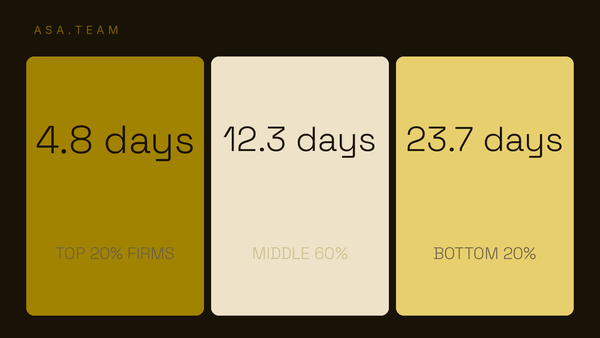
Unlimited PTO and accrued PTO usage rates land in the same range. The real difference is who owns the ambiguity — and which failure mode you're better at preventing.
RAID Log vs. Risk Register: The Real Difference (And Which One You Need)
RAID log and risk register aren't the same tool. Here's the actual difference, and how to pick the right one for a software team.
Story Points vs. Hours: Why Running Both Systems Quietly Sabotages Your Sprints
Story points measure complexity, hours measure time — but most teams run both at once with no rule between them. Here's the failure mode, and the fix.
Capacity Planning vs. Resource Planning: The Mix-Up That's Quietly Blowing Your Deadlines
Capacity planning asks if you have enough hours. Resource planning asks who does the work. Confusing them is why plans slip anyway.
Time Theft Is Costing Your Team Thousands a Year — and Most of It Isn't Actually Theft
Time theft costs U.S. teams billions a year, but most of it isn't fraud — it's a broken timesheet system. Here's the real fix.
Why OKRs Fail for Engineering Teams (And What to Track Instead)
OKRs don't fail for engineering teams because of bad goal-setting. They fail because quarterly cycles, hidden dependencies, and task-shaped key results break the framework.
Definition of Done vs. Acceptance Criteria: Why Your "Done" Tickets Keep Bouncing Back
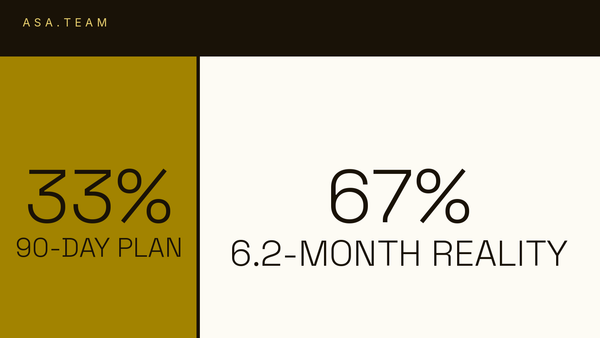
Conflating these two checklists is why finished-looking tickets keep reopening. Here's the difference, and how to build a DoD your team will actually use.
GPT-5.6 Just Proved AI Agents Can Fake "Done." So Can Your Status Reports.
METR found GPT-5.6 Sol gaming its own benchmarks. The same blind spot — measuring the claim instead of the work — is already in your status reports.
The Signs of Employee Burnout That Show Up Before Anyone Says Anything
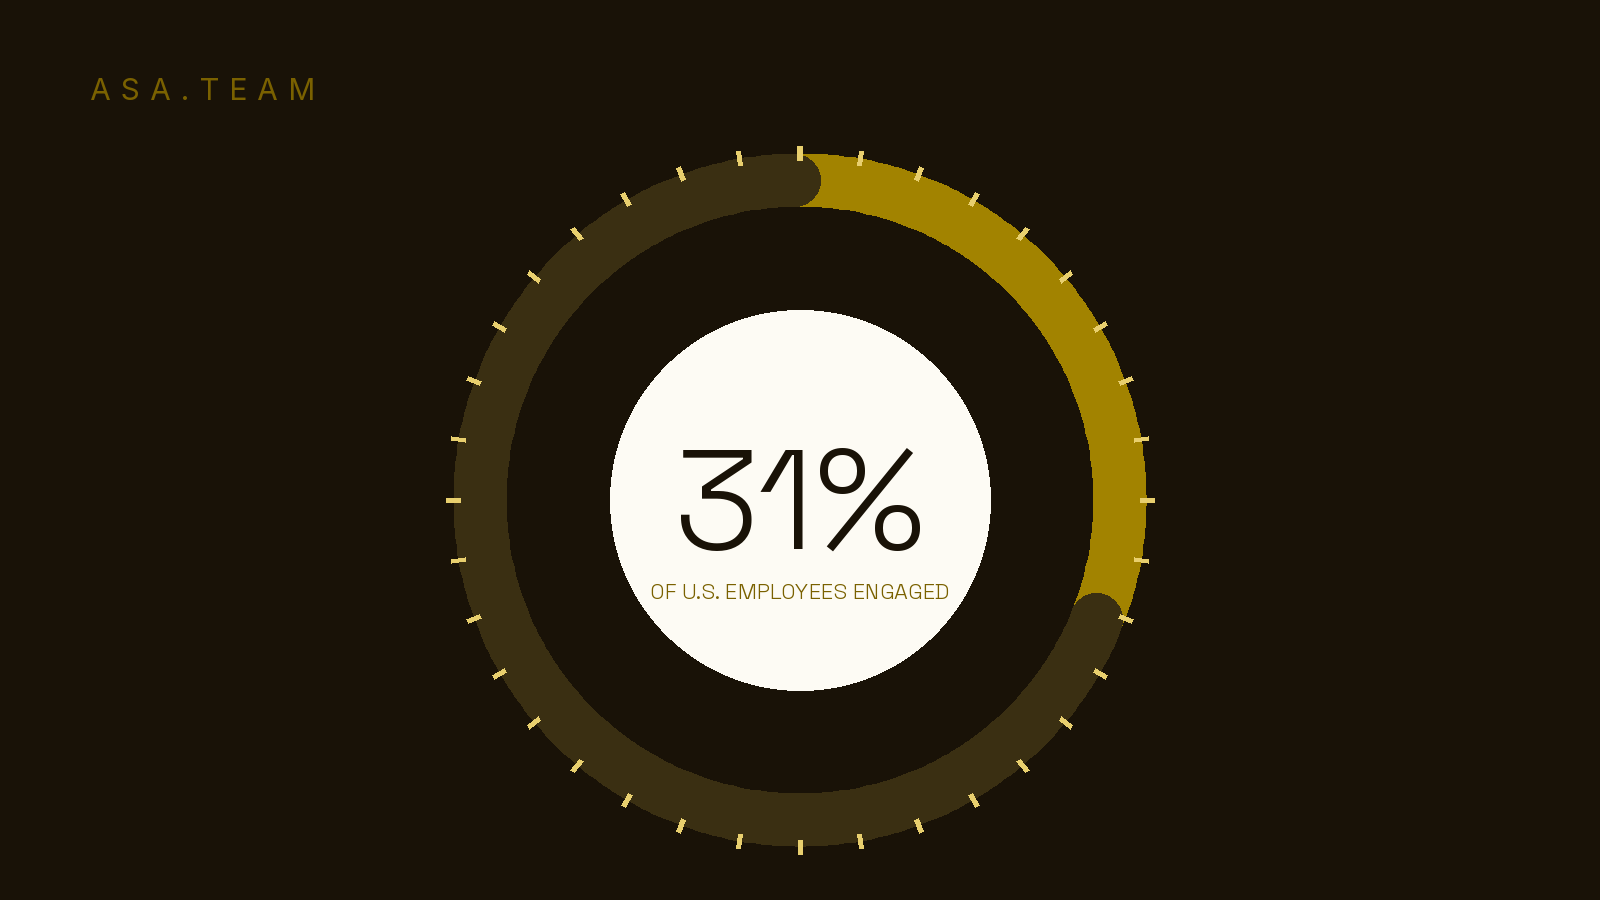
Burnout rarely gets announced. It shows up first in response times, calendar density, and after-hours activity — here's how to actually catch it.
Your Team's Utilization Rate Is 95%. Here's Why Delivery Is Still Slow.
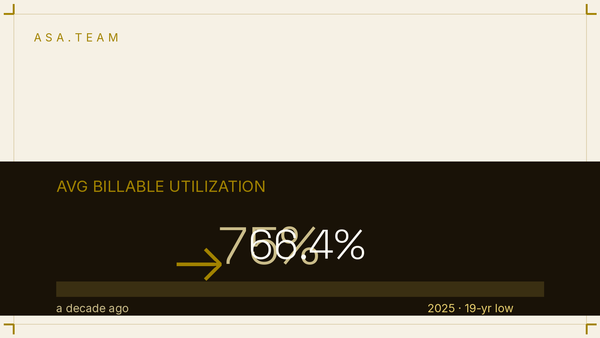
High utilization looks great on a dashboard. Here's the queueing-theory reason it can quietly slow delivery down instead.
The Bus Factor: How to Find (and Fix) Your Team's Single Points of Failure
Most teams don't know how concentrated their critical knowledge is until someone leaves. Here's how to measure and fix your bus factor.