How Much Time Do Sales Reps Spend Selling? The Real Selling-Hours Benchmark
How much time do sales reps spend selling? Salesforce says 28%, its own current page implies 40%, and Forrester puts admin alone at 14 of 51 hours. The disagreement is the story — and the 60% shadow block is the real benchmark.
How much time do sales reps spend selling? It depends who you ask — and the disagreement is the real story. Salesforce's survey of 7,775 sales professionals found reps spend just 28% of the week selling. Salesforce's own current statistics page puts non-selling work at 60%, implying 40%. Forrester pegs admin alone at 14 hours of a 51-hour week. HubSpot's sales trends research lands somewhere scarier: about two hours a day. One vendor's "selling week" is another vendor's rounding error.
That spread is not sloppy research. It is a definitional problem hiding inside a benchmark question. Underneath every version of the number sits the same block of invisible work — retyping call notes into the CRM, hunting for the right deck, chasing approvals — and that block, not the headline percentage, is what decides whether your revenue team has capacity. This piece reconciles the clocks, itemizes where the missing hours actually go, and shows why the vendor number matters far less than the one you audit yourself.
Three clocks: 28%, 40%, and 14-of-51
The most-quoted number in this space comes from a Salesforce-commissioned survey of 7,775 sales professionals conducted between August and September 2022, published in its 2023 State of Sales research: reps spend just 28% of their week actually selling, with the majority of their time consumed by deal management and data entry. Do the math on a 40-hour week and it is roughly eleven hours of customer contact.
Fast-forward, and Salesforce's current sales statistics page tells a friendlier story: sales reps spend 60% of their time on non-selling tasks — hunting for the right pitch deck, manually entering customer notes into the CRM, or chasing down internal approvals instead of talking to a customer. Flip it and the selling share is 40%, a 12-point jump in four years.
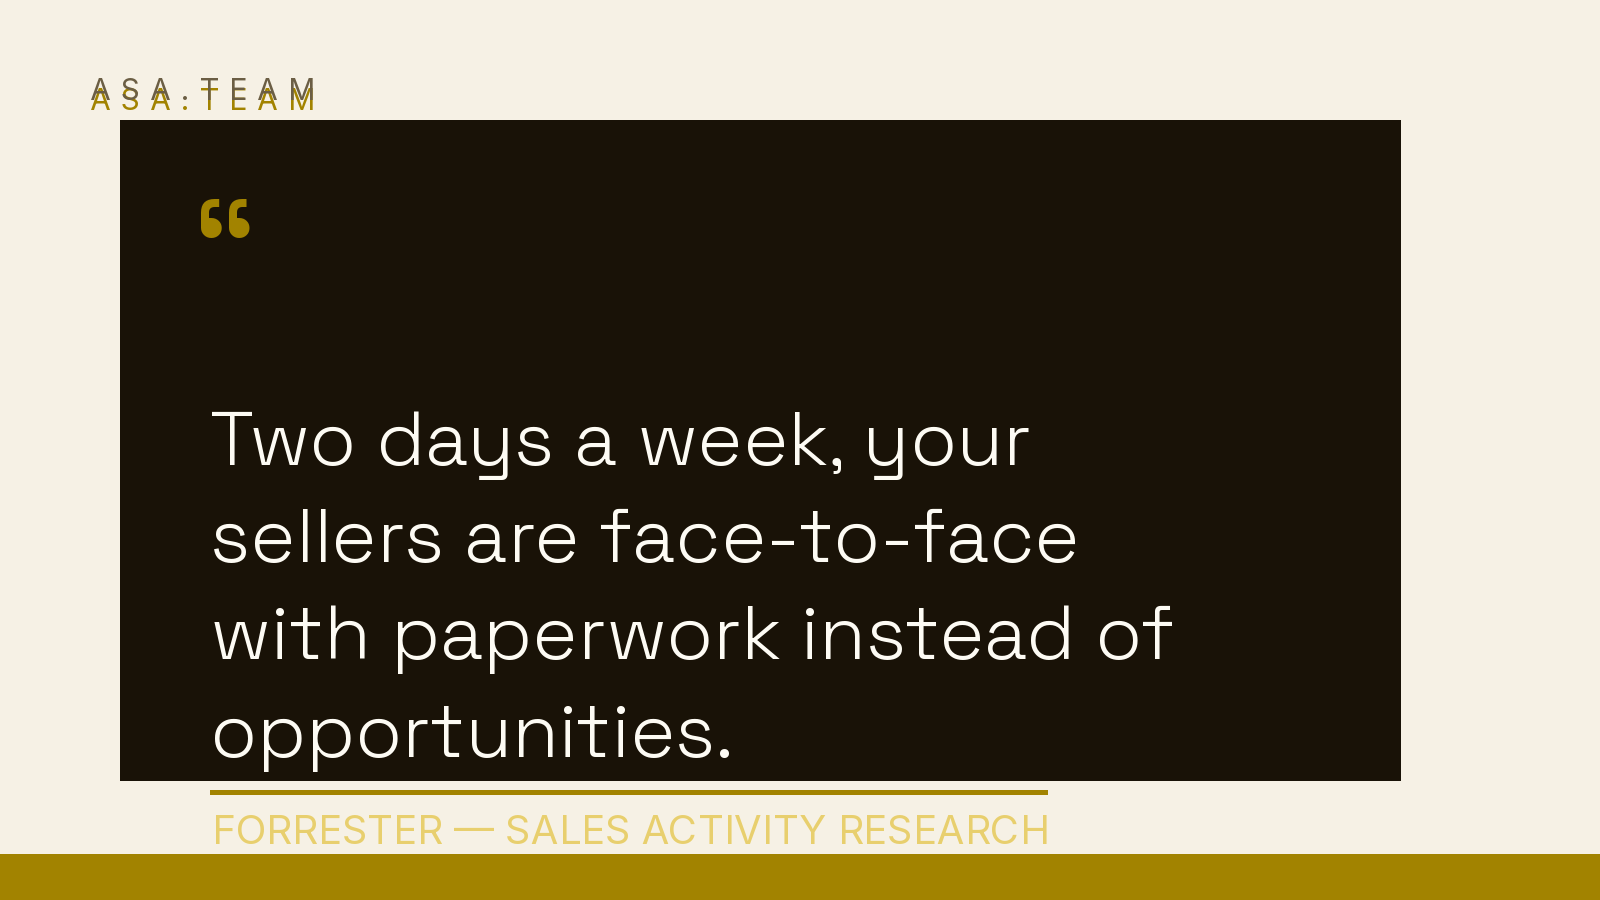
A Sales Almanac breakdown fills in the trajectory: 28% in the 2022 survey, 30% in 2024, and 40% in the 2026 edition, which surveyed 4,050 sales professionals across 22 countries. Gen Z reps sit lower at 35%. Meanwhile Forrester's sales activity research measures something adjacent but harsher: the average rep wastes about 14 of 51 working hours per week on admin alone — the firm's own phrasing is "two days a week, your sellers are face-to-face with paperwork instead of opportunities."
Placed side by side, the clocks disagree by up to 15 percentage points on the same question:
| Clock | Source | Sample | Selling share |
|---|---|---|---|
| 28% of the week | Salesforce State of Sales (2022 survey) | 7,775 sellers | ~11 of 40 hours |
| 30% of the week | Salesforce State of Sales (2024 edition) | separate sample | ~12 of 40 hours |
| 40% of the week | Salesforce State of Sales (2026 edition) | 4,050 sellers, 22 countries | ~16 of 40 hours |
| ~2 hours a day | HubSpot 2024 Sales Trends Report | sales professionals | ~10 of 40 hours |
| 14 of 51 hours on admin | Forrester sales activity study | average rep | admin alone eats 2 full days |
Notice that the clocks don't even measure the same denominator. Salesforce counts the share of a week; Forrester counts hours of admin out of a 51-hour week; HubSpot counts contiguous hours per day. A rep can truthfully report 40% selling on one survey and two productive hours on Tuesday.
Where the other 60% actually goes
Strip away the percentage debate and the itemized time is remarkably consistent across sources. The 2022 Salesforce survey attributed the majority of non-selling time to two buckets: deal management and data entry. The 2026 edition names manual data entry as the single clearest drain, especially for newer reps.
Salesforce's own current statistics page itemizes the non-selling block with unusual candor: hunting for the right sales pitch deck (an information-search problem), manually entering customer notes into the CRM (a double-entry bookkeeping problem), and chasing down internal approvals (a waiting-time problem). None of that is selling, and none of it feels like sales work — yet it is the job description reps actually live.
Two days a week, your sellers are face-to-face with paperwork instead of opportunities.
— Forrester, sales activity research
The tool layer makes it worse. The same 2022 research found sales teams use an average of 10 tools to close a deal, 66% of reps say they are overwhelmed by the number of tools, and nine out of ten sales organizations planned to consolidate their tech stacks over the coming year just to give sellers time back. Every tool added a sync problem: the call happened in one place, the notes belong in another, the approval lives in a third.
The performance ledger matches the time ledger. Ebsta's 2025 GTM Benchmarks report, built on analysis of $48 billion in pipeline data and a survey of 2,000 CROs, found that 78% of sellers missed quota in 2025 — up from 69% in 2024 — while top performers now close deals 11 times faster than their lower-performing peers, up from 8.9x the year before. The gap between your best rep and your average rep is not talent so much as drag: whoever loses the fewest hours to paperwork compounds them into revenue. This is the same coordination tax that eats delivery teams — itemized separately in our look at how much time teams spend on coordination — just wearing a quota.
Why the 40% number is the one to distrust
Of the three clocks, the rosiest deserves the hardest scrutiny. Selling time supposedly rose from 28% to 40% between the 2022 and 2026 editions of the same survey series. If that were real, selling capacity would have expanded nearly 40% in four years — and quota attainment should have climbed. Instead, Ebsta's benchmark data shows quota misses worsening from 69% to 78% over roughly the same window. Either reps gained hours they somehow can't convert, or the number moved as much by definition and sampling as by behavior.
The sampling caveat is conceded by the sources themselves: each State of Sales edition surveyed a different group of sales professionals, and "selling" is defined as direct buyer contact — calls, meetings, demos — which excludes preparation, follow-up drafting, and internal alignment that many reps would defend as selling work. Self-reported surveys also drift upward; a rep estimating their own week anchors on the calls they remember, not the forty minutes of CRM triage they forgot.
The Gen Z figure is the tell most roundups skip: younger reps spend 35% of their time selling against 40% overall, and Salesforce specifically attributes the extra load to manual data entry for newer sellers. The newest reps — the ones with the most runway and the least negotiating power over process — inherit the most paperwork. That mirrors the pattern we've seen on the delivery side of the business, where ramp-up time is mostly context acquisition rather than skill acquisition.
The practical lesson for founders and team leads: treat every industry headline — 28%, 33%, 40% — as a conversation starter, not a benchmark. The number that matters is your own time audit. Ask each seller to log a single week into two buckets: hours that touched a buyer, and hours that talked about touching a buyer (CRM updates, internal status meetings, approval chasing, deck hunting). Expect the gap to be wider than the surveys, and expect your senior people to look better than your juniors. The pattern is the same one behind the productive-hours-within-the-8-hour-day debate: self-reported clocks flatter, itemized ledgers tell the truth.
What good looks like
The fixable version of this problem is not coaching reps to "prioritize better." It is deleting the transcription layer between the work and the record. Consider a small agency where selling and delivery blur — the founder sells, the account leads manage, and the client conversation lives in Slack, WhatsApp threads, and shared inboxes. In the bad version, the CRM learns about a deal only when someone finds ninety minutes to reconstruct the week from memory, forecasts get built from that stale reconstruction, and the Monday pipeline meeting exists to interrogate people about what their notes should have captured.
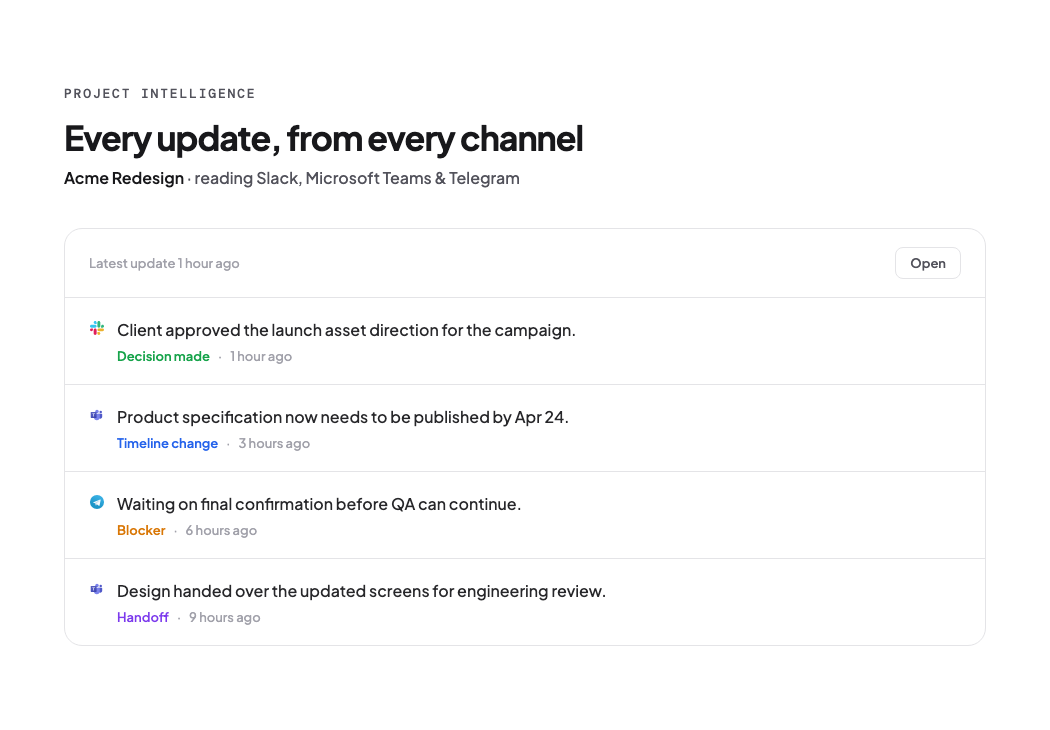
In the good version, the direction of work reverses: updates flow out of the conversations where they already happened instead of being retyped from memory at 6 p.m. Project Intelligence from Asa.Team surfaces status from Slack, Teams, Telegram, and WhatsApp, so the live picture of a deal or delivery is assembled from real signals — who said what, what's blocked, what moved — rather than from a manual update ritual. Blocked approvals surface instead of being chased, and the time audit stops being an exercise: the record reflects the work. The principle is bigger than any tool: if notes need writing, the system should capture them where the work happens.
Frequently Asked Questions
Do sales reps really only sell two hours a day? HubSpot's 2024 research suggests roughly two contiguous selling hours daily; Salesforce's 2026 figure of 40% works out closer to three. The definitions differ — one counts focused hours, the other counts calendar share. The consistent finding across all of them is that the majority of the sales week never touches a buyer.
What percentage of time selling is good? Most benchmark roundups treat 30-40% as the normal band for field reps, and pushing past 50% usually means the admin has been absorbed by someone or something else. Treat it as a diagnostic of process drag, not a KPI to manage by exhortation.
Why don't reps update the CRM? Because manual entry is delayed, unpaid-feeling bookkeeping on top of the actual job — Salesforce itself names it the clearest non-selling drain. Teams that capture activity automatically get better data not because reps behave better, but because the recording burden disappears.
The number that matters is yours
Three clocks, one honest conclusion: whatever the exact share, most of the sales week never reaches a buyer, and the gap between the 28% and 40% readings tells you more about survey definitions than about teams. The 60% shadow block — data entry, information hunting, approval chasing, status theater — is where the missing quota hide, where the 78%-missed-2025 number was manufactured, and where the 11x performance gap between your reps quietly widens.
So next Monday, run the two-bucket audit with your team: hours that touched a buyer, hours that talked about touching one. If the second bucket wins — and it will — the answer isn't a bigger CRM checklist or another standing meeting to talk about the meetings. It's shrinking the space between the conversation and the record, so the selling hours take care of themselves.