How Much Does It Cost to Replace an Employee? The Real Numbers by Role
How much does it cost to replace an employee? Ask HR and you'll get one number. Ask finance and you'll get another — usually a long pause, then a swear word.
How much does it cost to replace an employee? Ask HR and you'll get one number. Ask finance and you'll get another. Ask the founder who just watched their best engineer quit mid-project on a Tuesday afternoon, and you'll get something closer to the truth — usually a long pause, then a swear word.
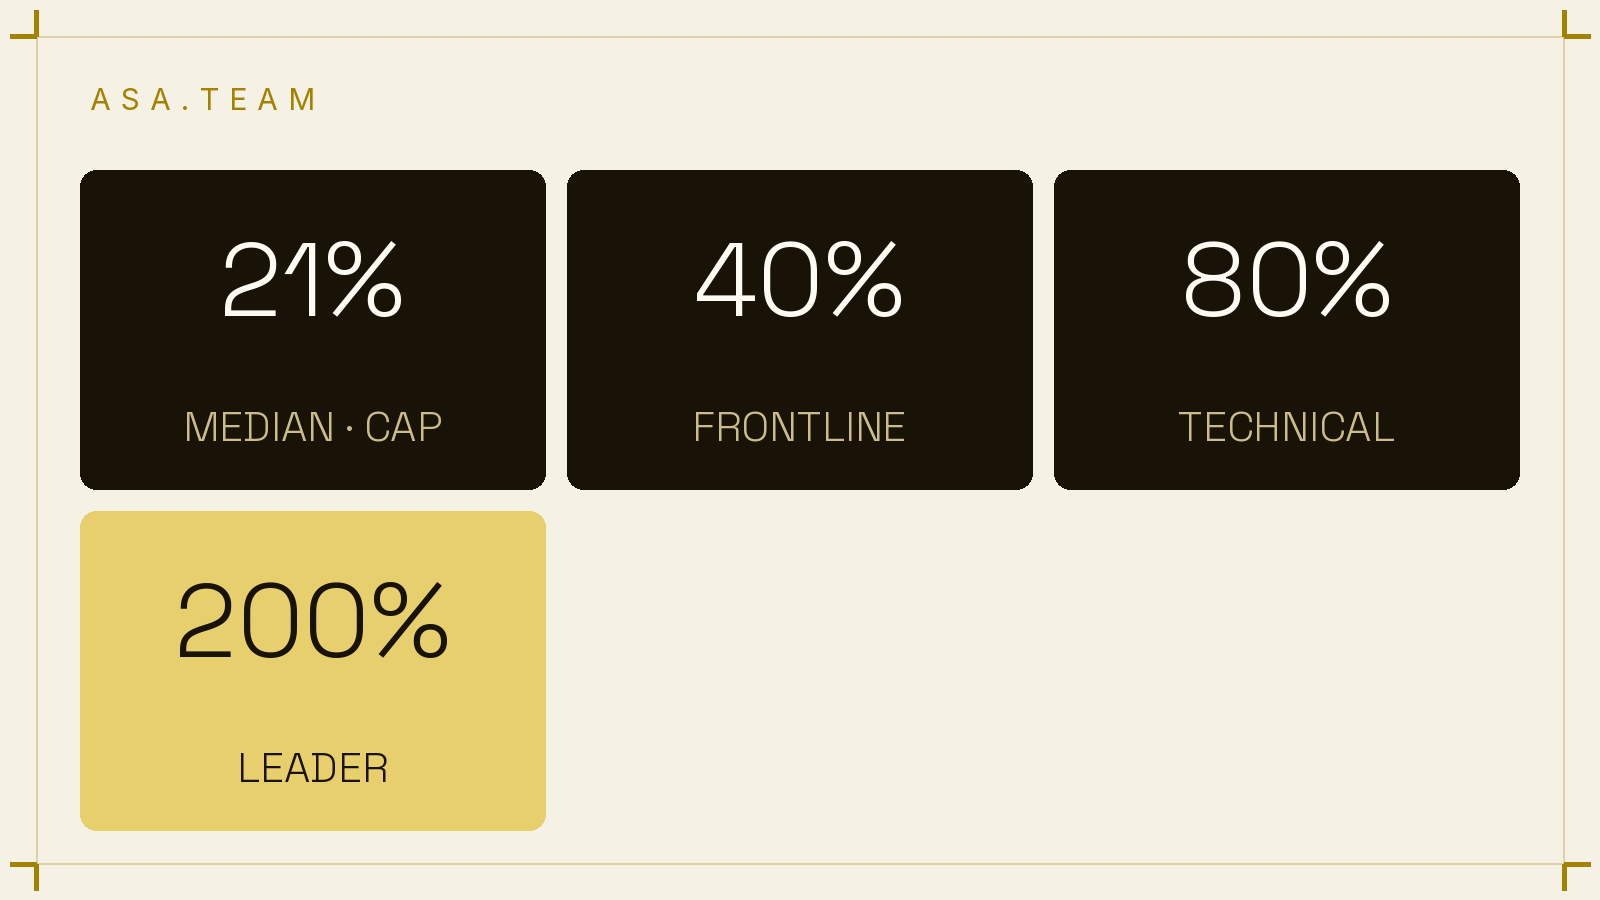
The confusion isn't anyone's fault. The research genuinely disagrees, because different studies are measuring different things. A 2015 analysis from the Center for American Progress put the typical cost at roughly one-fifth of an annual salary. Gallup puts it between 40% and 200% depending on the role. SHRM's headline benchmark is a flat five figures. All three can be right at the same time.
Here's the thesis: the number everyone quotes is usually the recruiting invoice, and the recruiting invoice is the smallest line item in the replacement cycle. The real cost hides in vacancy coverage, the productivity ramp, and the context that walks out with the person.
Two different questions are hiding behind one phrase
"What does it cost to replace an employee?" is actually two questions wearing the same coat.
The first is a recruiting question: what do we spend to get a warm body in the seat? SHRM's 2025 Talent Acquisition Benchmarking Reports track this precisely. The average cost-per-hire is $5,475 for non-executive roles and $35,879 for executive roles — executive hires run nearly seven times more expensive per seat. The same research shows the posting-to-offer process is highly segmented, with screening and interviewing alone averaging eight to nine days each.
The second question is an operations question: what does it cost the business that the work is now unstaffed, the knowledge is gone, and everyone else is covering? That one never shows up in a recruiting budget because it gets spread across the whole P&L — overtime here, a delayed launch there, a client noticing the slip.
When someone says "turnover costs us $5,000 per head," they are quoting the first question. When someone says "turnover costs us half a salary per head," they are quoting the second. The gap between those two sentences is where founders get ambushed.
This is also why small teams feel turnover so much harder than big ones. In a 400-person company, a vacancy gets absorbed by slack in the org chart. In an eight-person company, one departure is 12.5% of your capacity on day one — and the founder personally absorbs the gap.
What the research actually found
Start with the most disciplined attempt to answer the question with evidence rather than vendor enthusiasm. The Center for American Progress synthesized 30 case studies across 11 economic papers published between 1992 and 2007. Their headline finding: employers spend about one-fifth of an employee's annual salary to replace them. Excluding executives and physicians, the median landed at 21%. For positions paying under $30,000, it was 16%. The full range across studies ran from 5.8% to 213% — depending on the job and the skills involved.
Gallup's numbers are bigger, and they're organized by role tier rather than by salary band:
"The replacement of leaders and managers costs around 200% of their salary, the replacement of professionals in technical roles is 80% of their salary, and frontline employees 40% of their salary." — Gallup, 2025
The table below uses the same salary ($80,000) so you can see how wildly the answers diverge.
| Role / measure | Replacement cost | Dollars at $80K salary | Source |
|---|---|---|---|
| Cost-per-hire, non-executive (recruiting only) | flat benchmark | $5,475 | SHRM 2025 |
| Frontline employee | ~40% of salary | ~$32,000 | Gallup |
| Technical / professional | ~80% of salary | ~$64,000 | Gallup |
| Manager / leader | ~200% of salary | ~$160,000 | Gallup |
| Median across 30 economic case studies | ~21% of salary | ~$16,800 | CAP |
Read that table carefully, because the disagreement is the story. CAP's median of roughly a fifth of salary reflects the economic cost measured in the studies — separation, hiring, training, lost productivity. Gallup's tiers reflect what consultants charge clients when a whole replacement cycle gets costed out role by role. Neither is lying. One counts receipts; the other counts consequences.
For planning purposes, the honest answer is: budget the recruiting invoice as one line, then separately estimate the vacancy and ramp time as a percentage of that person's output. Most budgets only have the first line.
Why one exit costs $12K here and $90K there
If the typical case is around 20% of salary and the worst cases hit 213%, what separates them? Four levers, mostly under management's control.
Vacancy time. SHRM's benchmarking shows screening and interviewing each run 8–9 days before an offer even exists. Add notice periods and start dates and the seat sits empty for weeks. During that window the work doesn't stop — it gets distributed to the people who didn't quit, which is how one resignation quietly becomes three.
The productivity ramp. A replacement is not a clone of the person they replace. We benchmarked this separately: new hires typically need several months to reach full productivity, with the spread across roles running from under three months for support positions to almost a year for complex enterprise sales roles. A $100K hire who takes nine months to reach full output is costing you the vacancy gap plus a nine-month discount on a full salary — that math alone can exceed the recruiting invoice several times over.
The team ripple. Turnover is contagious, and disengagement is the fuel. Gallup's 2025 global report estimates low engagement costs the world economy $10 trillion in lost productivity — about 9% of global GDP — and every departure a team watches raises the odds of the next one. The burnout research points the same direction: roughly half of employees report burnout symptoms in most surveys, and burnout is a leading predictor of quitting.
Whether the exit was preventable. This is the biggest lever, and Gallup's finding here deserves emphasis: about 42% of turnover is preventable, and 70% of those preventable exits trace back to the day-to-day experience of being managed — not pay. Twenty-one percent of preventable leavers said better daily interactions with their manager would have kept them. Thirteen percent pointed to frustrating organizational issues, 11% to missing career paths, and 9% to staffing and workload.
The line that never appears on the invoice
There's a fifth cost that no benchmark table captures cleanly, and it's the one that keeps founders up at night: context loss.
Your senior engineer doesn't just leave with her hours. She leaves with the reason the billing module is structured that way, the name of the client contact who actually approves things, the three landmines in the legacy deployment script, and the Slack thread from March that explains why feature X was quietly killed. None of it is documented, because while she was there, nobody needed it documented. It lived in her.
Regular one-on-ones catch some of this early — that's the point of cadence. But the deeper problem is visibility. Most of what's actually happening in a company flows through chat: the blocker raised in Slack on Wednesday, the scope change agreed in a Telegram group, the client's real reaction buried in a Teams channel. When nobody is aggregating that stream, managers only discover someone's frustration after the resignation letter, and they only discover the knowledge gap after the person who held it has left.
The preventable-turnover numbers make sense in that light. "Problems with staffing or workload" — 9% of preventable exits — is almost always visible in the work itself months before someone quits. So is a high performer slowly disengaging from projects nobody acknowledges. The data exists. It just isn't in front of the manager.
What good looks like
Good turnover math has three lines, not one: the recruiting invoice (SHRM's $5,475), the vacancy-and-ramp cost (20–80% of salary as a working range), and the preventability rate. If more than a third of your exits look preventable in hindsight, the replacement budget is really a management-feedback budget in disguise.
The prevention play is visibility. If 70% of preventable exits trace to how people are managed day to day, the fix is putting the daily reality of the work in front of managers before it becomes a resignation. That's the exact job Project Intelligence does at Asa.Team: it listens to the project chatter your team already produces in Slack, Teams, Telegram and WhatsApp and turns it into a live picture of what's moving, what's stalled, and who's carrying too much — no status meetings, no self-reported spreadsheets.
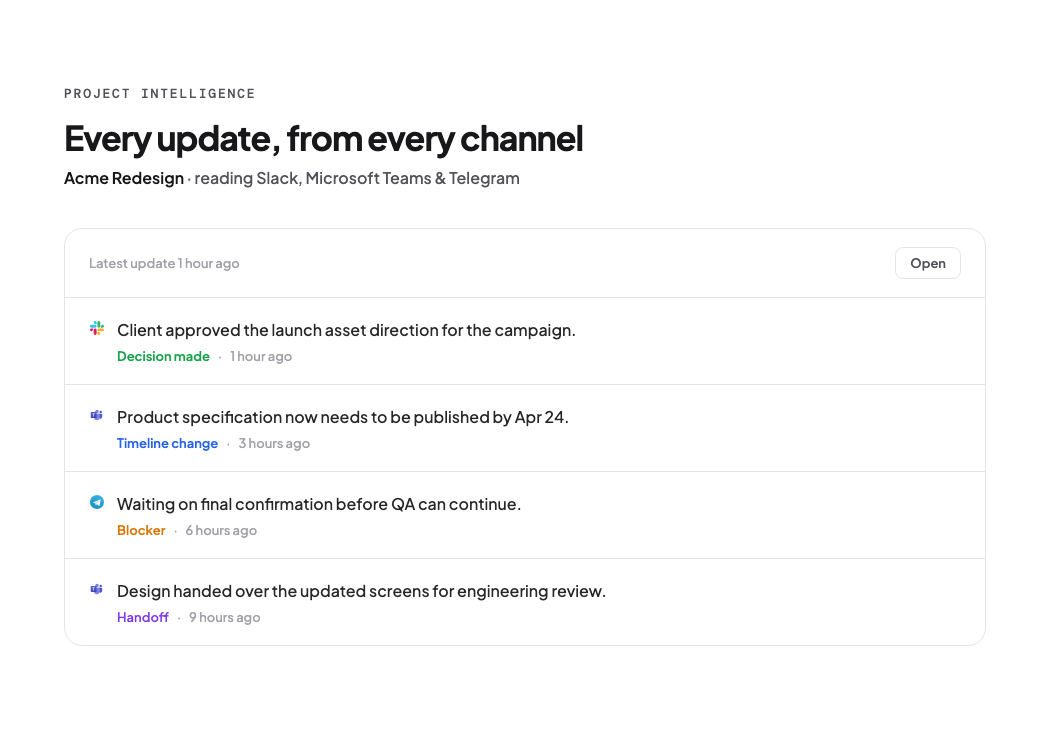
Teams that run this way catch the Wednesday blocker, notice the sprint that quietly got heavier for one person, and have the workload conversation in September instead of the counteroffer in November. That's the difference between the 20% replacement cost and the 200% one.
Frequently asked questions
How much does it cost to replace an employee in dollars? It scales with salary. The median across economic case studies is about 21% of annual salary — roughly $16,800 for an $80,000 role. Gallup's role-tier estimates run from 40% for frontline workers to 200% for managers, and SHRM's recruiting-only cost-per-hire sits at $5,475 for non-executive roles.
Is cost-per-hire the same as replacement cost? No. Cost-per-hire (advertising, agency fees, screening, interviews) is the recruiting invoice. Replacement cost adds separation costs, vacancy coverage, onboarding, and the months of reduced output while the new hire ramps. Budgeting cost-per-hire alone typically undercounts the true cost by multiples.
Which employees are the most expensive to replace? The harder the role is to hire, the bigger the multiplier. CAP's case-study range topped out at 213% of salary for highly educated roles, and Gallup pegs leader and manager replacement at roughly twice salary because the role compounds: the team loses its coordinator, its escalations route, and its memory at once.
How can you tell if a resignation was preventable? Exit conversations mostly tell you. Gallup finds the leading preventable causes are manageable — daily manager interactions, organizational friction, missing career paths, and workload. All four usually show up in the work trace before they show up in a resignation letter, which is the case for making project and workload signals visible to managers.
The bottom line
How much does it cost to replace an employee? Somewhere between one-fifth and twice their salary — and the number your budget currently contains is the recruiting invoice, which is the only part anyone remembers to track. About two-fifths of exits are preventable, and the preventable ones mostly trace to the daily experience of work: invisible workload, unacknowledged effort, problems managers could have seen coming.
Before your next departure, ask a different question than "what will recruiting cost?" Ask how much of the leaving was visible in the work itself months earlier — and whether anyone was looking.