How Much Time Do Developers Spend on Unplanned Work? The Real Firefighting Benchmark
DORA says 21%, Stripe says 42%, and one telco measured 80%. The spread between the unplanned-work benchmarks is the real story — and it's how you find your team's number.
The sprint plan carried one unstated assumption — how much time the team would actually have for the work on the roadmap. It assumed two weeks, twelve tickets, and a demo on Friday. Then Wednesday: the login flow broke after a vendor update, a top account escalated a data bug at 4pm, and the compliance team needed a report "as soon as possible." By Friday, maybe four tickets were done, and nobody can say exactly what happened to the other eight. This is what unplanned work does — it doesn't arrive as a number on a dashboard, it arrives as a thousand small interruptions, and by the time you measure the damage it has already eaten the roadmap.
If you are a founder or team lead asking how much time developers spend on unplanned work, you will find an answer between one in five hours and nearly half. Both are "true," and the spread is not noise — the disagreement between the benchmarks is the story, and it explains why engineering plans quietly fail while everyone stays busy.
What "unplanned work" actually means (and why the definition drives the number)
The clearest definition comes from DevOps research: work that arrives outside the plan and cannot wait. DORA's landmark State of DevOps report counts "any break/fix work, emergency software deployments and patches, and responding to urgent audit documentation requests" as unplanned. That is the narrow reading: incidents, emergency fixes, forced interruptions.
Consultancies use a wider net. Equal Experts, who have spent two decades untangling slow delivery, define unplanned tech work as reactive fixes and emergency maintenance — configuration errors, defects, deployment failures, environment issues, security vulnerabilities, test failures. Nearly everything that isn't the team proactively building product.
This distinction matters because the two readings measure different volumes. The narrow definition lands in the 21–27% range. The broad one, which includes routine maintenance and debugging, can double it. When someone quotes a "47% of engineers' time" stat next to a "21%" stat, they are not disagreeing about reality — they are describing different things, and the answer to "how much time is really going to unplanned work" is really "which question are you asking."
The benchmarks: 21%, 27%, 42%, and one horror story
Each credible source measures something slightly different, so here is the whole table before we reconcile it:
| Source | What was measured | Number | Caveat |
|---|---|---|---|
| DORA, State of DevOps 2016 | Self-reported time on unplanned work and rework | 21% (high performers) vs 27% (low performers) | Self-reported; treat as a band, not a benchmark |
| Stripe, The Developer Coefficient | Hours per week on maintenance (debugging, refactoring, bad code) | 17.3 of a 41.1-hour week, ~42% | Estimates; maintenance is broader than unplanned work |
| Equal Experts, telco case | Utilized capacity on unplanned tech work | 80% across 20 teams | An extreme, not a typical figure |
| Industry practice | Capacity buffer reserved for unplanned items | 20–30% | A rule of thumb, calibrated by many teams |
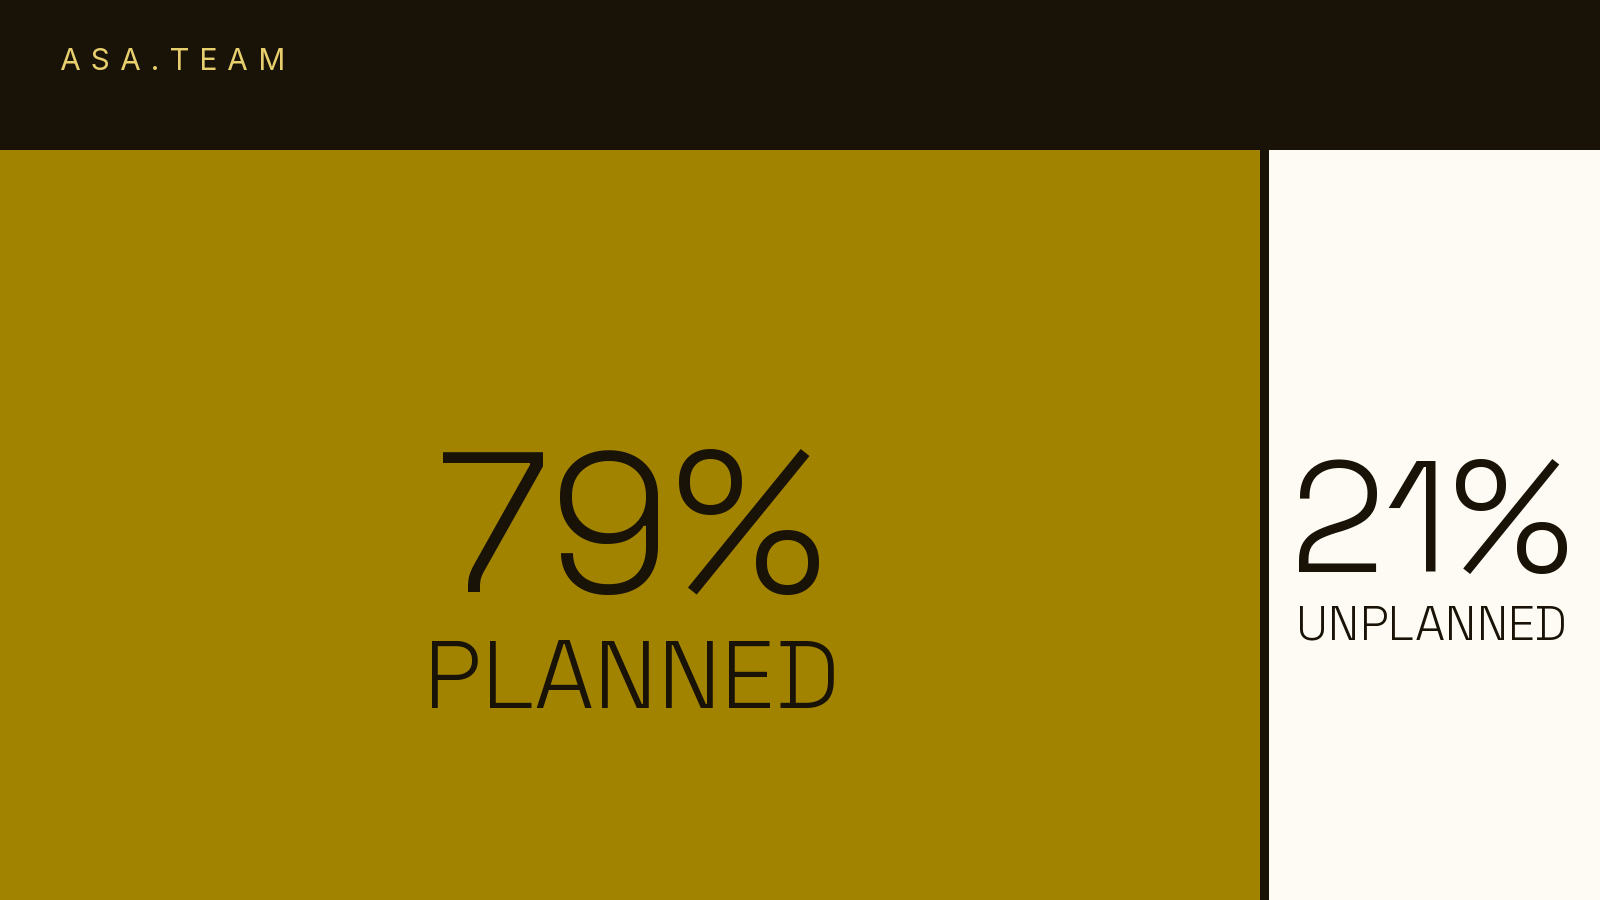
The DORA numbers are the anchor. The 2016 State of DevOps Report found high performers spent 49% of their time on new work and just 21% on unplanned work and rework, while low performers managed 38% new work against 27% unplanned. High performers do 29% more new work than low performers, and DORA found continuous delivery predicts less unplanned work in a statistically significant way — smaller, reversible changes simply produce fewer emergencies.
Stripe's Developer Coefficient sits at the other end of the definition spectrum: the average developer spends 17.3 of a 41.1-hour workweek on maintenance like debugging and refactoring, plus about four hours a week on "bad code" — roughly $85 billion a year in opportunity cost worldwide. That is ~42% of the week, but it counts work many teams would file under "keeping the lights on," not "the fire that ruined the sprint."
Every point of unplanned work comes straight out of new work. The question is never whether your capacity is spent — it already is — but whether it's spent on the roadmap or on the roadmap's consequences.
And then there is the case that breaks the scale: Equal Experts' British telco where twenty teams, asked to guess their value-add split, confidently predicted 80/20 — and measured out at 20/80. Four out of five hours were going to unplanned tech work nobody had ever budgeted.
Why unplanned work never looks real on the calendar
Here is the uncomfortable part: nobody experiencing 42% unplanned work believes they experience 42% unplanned work. The telco manager predicted 80/20 in the other direction. The loss is invisible for a structural reason — unplanned work arrives in small pieces. A thread here, an urgent fix there, a twenty-minute escalation. It never appears as a single line item, so it never registers as the catastrophe it is. If a factory scrapped a fifth of its material every day, someone would be fired; engineering absorbs a similar loss as business as usual.
What does show up is time not coding. Microsoft Research's 2024 developer workweek study surveyed 484 developers and found the gap between how they actually spend the week and how they want to: in the real week, communication and meetings take the largest single slice (~12%), with coding at ~11% and debugging at ~9%. In the ideal week, developers want coding to roughly double, to ~20%. The "extra" hours don't vanish into thin air — they leak into interruptions, status questions, support tickets, and firefighting that the calendar never labels as work.
This is the part most "developer productivity" conversations miss. The question is not really how many hours do engineers code — some heartbeat-based datasets peg real coding at under two hours a day — but what displaces the work the team planned to do. If you want one honest internal link for that: we covered why time tracking doesn't fix sprint estimates and why busy teams still miss deadlines — both are the same capacity leak wearing different clothes.
What good looks like
Teams that beat the benchmark do three things. First, they measure before they fix — a two-week exercise of sorting completed work into new value, maintenance, and rework, with zero blame attached. The telco's turn-around started exactly that way. Second, they budget for the leak instead of denying it: mature teams reserve 20–30% of capacity for unplanned items and plan the roadmap on the rest, which makes promises the team can actually keep. Third, they split the leak by source — incidents, urgent requests, rework — because each has a different owner and a different fix, and one blended bucket funds the wrong remedy.
There is a quieter lever, though, and it's the one most engineering leaders underuse: unplanned work almost always announces itself in chat before it becomes a ticket. The broken login flow starts as "anyone else seeing this?" in a channel; the big-account escalation starts as a forward; the compliance ask starts as a DM. The problem is not that the signal is missing — the problem is that the signal is scattered across Slack, Teams, Telegram, and WhatsApp groups, and it takes a standup or a status chase to assemble the picture.
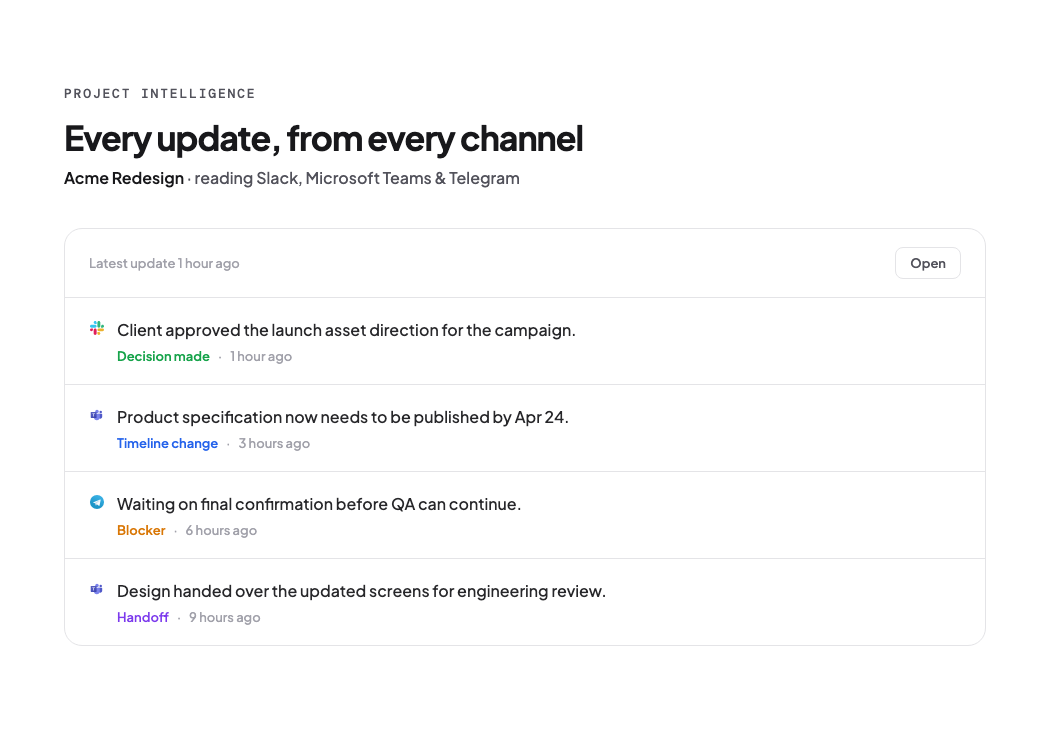
That is where Asa.Team's Project Intelligence earns its place: it surfaces updates from Slack, Teams, Telegram, and WhatsApp so a leader sees — today, not at the retro — that three of this week's "outliers" were one recurring production issue and a compliance request that was never triaged. The measurement problem does the telco's manager did by hand, the platform does continuously, and the roadmap finally gets the honest denominator.
Frequently Asked Questions
How much time do developers spend on unplanned work? It depends on the definition. Narrow break/fix measurements land around 21% for healthy teams and 27% for struggling ones (DORA). Broad maintenance definitions reach ~42% of the week (Stripe). Unmeasured teams in failure mode can hit 80%.
Is unplanned work always bad? No. It is usually a property of the system, not the people — incidents mean quality gaps, urgent requests mean unclear priorities, rework means rushed releases. And during product discovery, unplanned work that changes direction is often the most valuable work a team does.
How do I measure it on my own team? Take the last two weeks of completed work and sort each item into new value, maintenance, or rework. Directionally correct beats precise, and individual blame is banned from the exercise.
Is this the same as context switching? No — context switching is the mental cost of bouncing between tasks already in the plan; unplanned work is the volume of work that was never in the plan. Both drain the same capacity, but they need different fixes.
The roadmap is a fiction you agree to
Every benchmark points the same direction with different precision: engineering capacity is not free, the roadmap prices it as if it were, and the difference is paid out of people's evenings. The spread between 21% and 42% is not an accounting squabble — it is a map of where your own team is. A team at 21% is running a healthy shop with a healthy buffer. A team at 42% is running the same shop and pretending. And a team at 80% doesn't know they exist.
So the question for your next planning session is not "why did we only ship half?" It is: what will the plan look like if it starts from the measured number — not 100%, not hope, but the honest share of capacity your team actually has for the work you planned for them to do.