Approval Bottleneck Statistics: The Real Waiting Time Inside Work Approvals
Work spends most of its approval life parked in a queue that never shows up on a status report. The statistics on how long approvals really wait — from 15-minute signatures to 5.8-day executive stages — reconciled.
Your project plan says "awaiting approval" — six days on. The approval bottleneck statistics behind that wait tell a blunt story: the work is done; someone just hasn't said yes yet. If you've ever stared at a status that reads "waiting for review," you already suspect what the approval bottleneck statistics show: in most organizations the slowest part of a decision isn't the decision at all. It's the time before anyone opens it.
The numbers we gathered below tell a consistent story, but only if you read them carefully, because most of them don't actually measure the same thing. Some clocks start when a document is sent. Some start when the work is finished. The ones that measure the whole wait tell the more uncomfortable story: work spends most of its approval life parked in a queue, and the queue is almost invisible in status reports.
This is the reconciliation that matters for founders and team leads: the yes usually arrives quickly once it's asked. Getting it asked — or getting someone to ask — is where days disappear.
Two clocks: the signature takes 15 minutes, the approval takes days
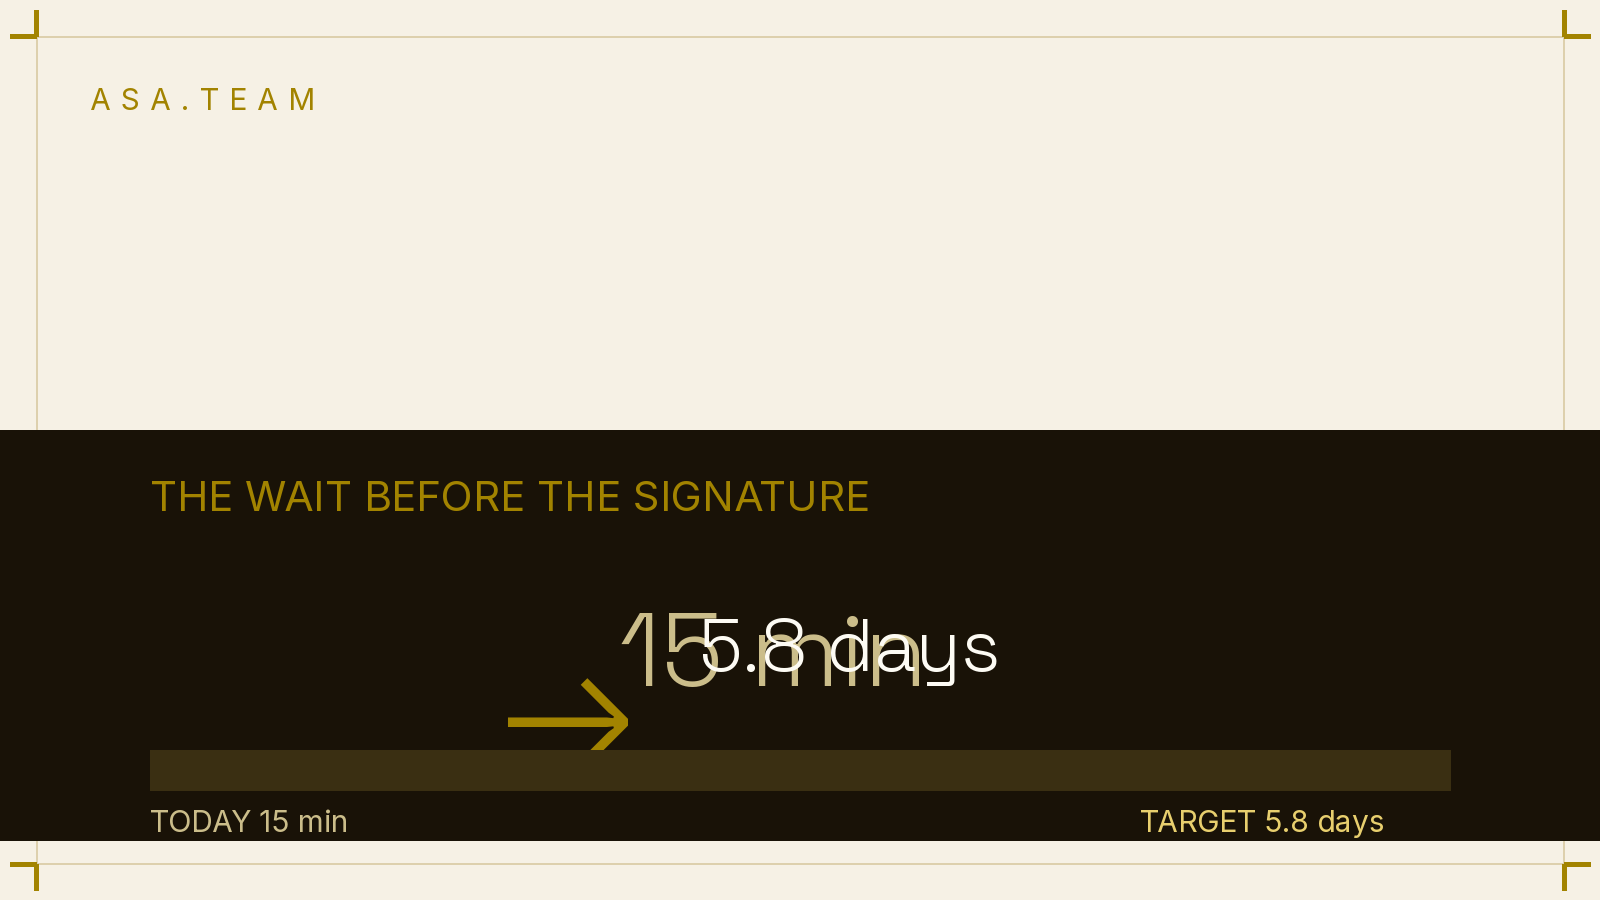
Start with the cleanest evidence of that split. Docusign's own platform data for fiscal 2025 shows that 40% of successful e-signature transactions complete within 15 minutes, and 76% complete within 24 hours. When a document actually reaches the person with the pen, the act of approving is often a coffee break. That number is real, and it is also misleading on its own — the Docusign clock only starts once the agreement is already queued for signature.
Now compare the interval before that clock. The analysis of thousands of enterprise transactions by procurement analytics firm Vertice, covering Q1 2026, found that the executive approval stage alone averages 5.8 days. Sixty-four percent of executive approval tasks do finish within a day — but that average is dragged up by the requests that sit in someone's queue for a week while their team treats them as done.
The table below shows how the headline "approval time" changes depending on where the measurement starts. This is the comparison most status reports skip:
| What is measured | Typical result | Source and scope |
|---|---|---|
| Completing an e-signature | 40% under 15 min; 76% under 24 h | Docusign platform, fiscal 2025 |
| Executive approval stage in procurement | Average 5.8 days; 64% within 1 day | Vertice, Q1 2026 |
| Organizations naming internal review/approval as a leading delay cause | 62% | U.S. government acquisition benchmark, 2026 |
| Working time spent making decisions | 37% on average | McKinsey survey, 1,259 leaders in 91 countries, 2018 |
Signing is a sprint. Approval is a parking lot. The gap between 15 minutes and 5.8 days is not a disagreement about speed — it is two different clocks, and the slow one runs in the dark.
Each row is honest. Stacked as one sentence, they are not. If you told a founder "signatures return in 24 hours, mostly within an afternoon," they would reasonably conclude their approval problem is solved. The Vertice stage metric shows that the document was doing the opposite — waiting, unopened, for days before anyone pressed send at all. And in the public sector, 62 percent of acquisition benchmark respondents named internal review and approval as a leading cause of delay outright. People know the queue is slow. They just don't measure the queue, so the number that shows up in reports is the fast one.
Invoices: where the waiting tax is measured most honestly
If approvals feel anecdotal in most workflows, invoices are the counterexample. Finance teams have been measuring approval delays for decades, and the numbers are blunt. Invoice approval bottleneck statistics compiled from Ardent Partners' 2025 research show that the average accounts-payable organization spends $9.40 to process a single invoice. Best-in-class teams spend $2.78. The difference is mostly a difference in how long the invoice waits for people.
Cycle time tells the same story. Finance organizations that run manual, email-and-forwards approval processes average around 17.4 days to process invoices, against roughly 3 days for leading teams — a nearly six-fold gap for the same document doing the same journey through the same company. Notably, it isn't the invoice's data that makes the difference; it's whether anyone knows which human is supposed to act next.
When teams do get specific about the causes, approval waiting shows up in the top three. A third of AP teams (33%) report that approvers and stakeholders take too long, and 14% of invoices need exception handling — coding errors, missing information, an approval that stalled in the wrong inbox — each adding days. For the first time in Ardent Partners' nineteen years of annual AP research, exception handling became the number-one challenge teams reported, cited by 53% of professionals. The work is rarely the problem. The routing of the work to a waiting human is.
The AP world is also honest about how the wait is measured. Factura's own framing puts it plainly: in many organizations approvals account for more than 60% of total invoice processing time. Sixty percent of the elapsed days are spent doing nothing except waiting to be seen. Most teams would call that "in progress" on a project board.
The layer tax: why the average hides the queue
Here is where approval statistics get genuinely useful for people who run projects rather than process invoices. McKinsey's decision-making survey of 1,259 leaders across 91 countries found that roughly 37% of working time is spent making decisions — and that 61% of respondents said most of that time is not actually productive. But the most actionable finding is structural: organizations with just one to three approval layers reported quick decisions at a rate of 61%, while those running seven or more layers reported them at only 38%.
Every layer is a queue. Five layers doesn't mean one decision; it means five small waits that compound silently, none of which is individually alarming. A two-day hold at layer three never appears in your status report because the project is technically "on track" at every checkpoint — it's just that the aggregate of all the small waits is where the time actually went.
The way out of this, according to people who instrument these workflows, is to measure stages rather than totals. The benchmark framework used by approval-workflow analysts distinguishes cycle time (submission to final decision, what the requester feels) from stage turnaround (entry and exit of each review step, where the delay lives). A bottleneck, in their definition, is not an average that feels slow — it is a stage that repeatedly misses its target and accumulates aging requests. Averages hide that. Stage-level measurement finds it immediately: one slow round can disappear inside an overall figure when several quick stages pull the mean down.
What the stage view also reveals is that not every wait is the same kind of wait. The way PM analysts separate it is crisp: a request that gets attention fast but comes back for clarification is a readiness problem. A complete request that sits untouched for days is an ownership or capacity problem. That sentence is worth pinning above your project board, because the two problems need completely different fixes — better briefs versus someone actually being accountable. In regulated environments the pattern gets extreme: one university workflow study tracked median protocol approval growing from 75 to 86 days over three years. The approvals weren't slower. The queues got longer.
What good looks like
Teams that fix the queue do three things that are unglamorous and consistent. First, they measure stage turnaround, not just cycle time — so a two-day hold on "VP review" shows up as its own number instead of hiding inside a green status. Second, they cap the layers and make the last approver explicit, which is the workflow equivalent of the 1–3-layer finding above. Third, and hardest: they make the waiting work visible in the same places people already look.
That third point is where the problem usually dies. Approval waits live inside project updates, not inside approval systems. The "still needs finance sign-off" that costs six days arrives as a passing line in a Slack thread three people deep, or never arrives at all — which is why status meetings exist in the first place: the human form of polling a queue nobody can see, and why they cost so much. The same thread that contains the waiting also contains the work done since then; the problem is that humans don't re-read threads, they re-ask.
Project Intelligence closes this gap by turning the chat trails themselves into status. Asa scans Slack, Microsoft Teams, Telegram and WhatsApp conversations for project-relevant updates and reconstructs what is moving, what is finished, and what is parked — including the parked-but-unfinished items that never make it to a status update. Instead of asking "where is this?" every day, the board already knows someone has been sitting on it since Thursday. The queue stops being invisible, which, per every statistic above, is the entire problem.
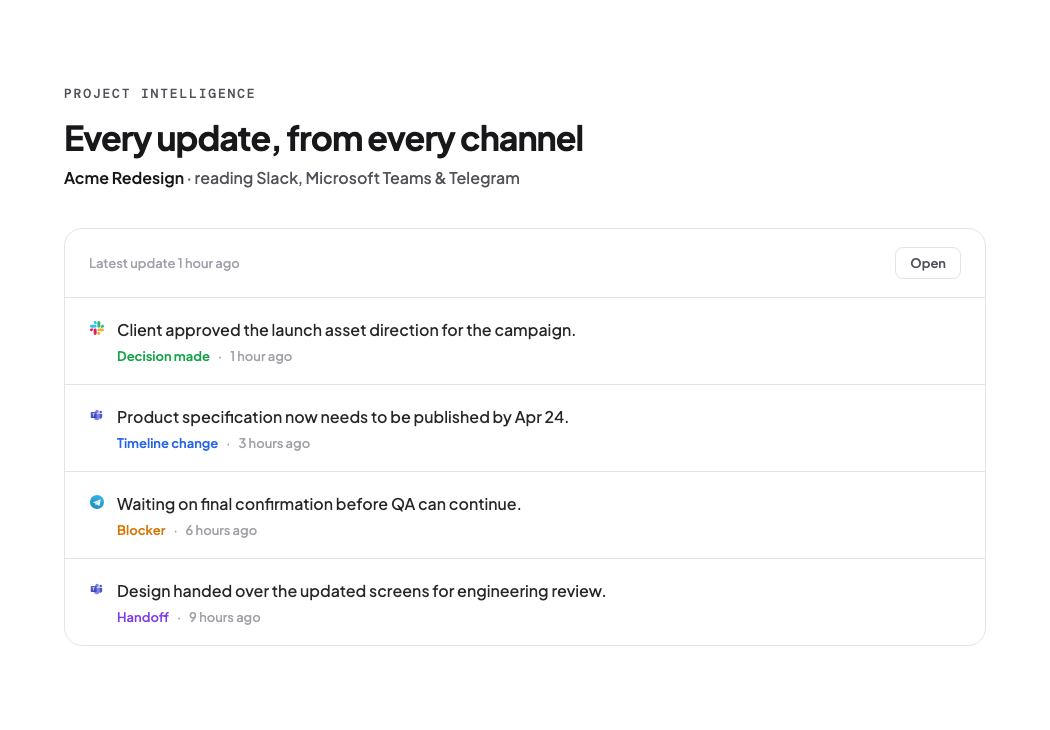
A founder running five workstreams doesn't need more meetings to discover a blocked approval. She needs the wait to appear on her dashboard with a timestamp, like every other number that matters. Project updates that get lost in Slack are the delivery problem. The updates that were never sent because the item is technically "in approval" are the silent half of the same coin.
Frequently Asked Questions
How long should an approval take in a healthy organization?
The fastest benchmarks put executive-stage approval within one day (64% of Vertice's Q1 2026 sample), and best-in-class invoice teams hold their entire processing cycle near three days. That doesn't mean every approval takes a day — it means the queue is short enough that day-two is unusual, not routine.
Why do approval averages vary so much between studies?
Because the clocks start in different places. E-signature data starts when the document is sent; workflow analytics start when the work is finished. A benchmark that says "76% in 24 hours" and one that says "5.8 days" can both be true — they're timing different halves of the same wait.
Is adding an approval layer ever the right call?
Only when the layer changes the decision. As the layer data shows, extra layers mostly convert decisions into waits — 61% quick decisions with 1–3 layers versus 38% with seven or more. If a reviewer doesn't alter outcomes, remove the reviewer and shorten the queue.
Final thought
The uncomfortable lesson of approval bottleneck statistics is not that approvals are slow. It's that the waiting is invisible to the people whose timelines it eats. Signing takes minutes for the person who signs; the cost is paid by the people whose work has already stopped, who keep hearing "almost done." If you can't name how long each open item has been waiting, you don't have a speed problem — you have a visibility problem wearing a speed disguise.
So this week, try the smallest possible fix: put a timestamp on every "awaiting approval" in your tracker, and count how many of them are older than the work itself. The queue is there. The statistics all say so. The only question is whether your status reports are measuring the fast clock or the honest one.